Lesson 02: Meet Stella — Your Debugger and Best Friend
Part 0: Foundations · Estimated time: 50 minutes Prerequisites: Lesson 01 (you must be comfortable reading hex) You will learn: Loading ROMs, the debugger, stepping, watching registers, reading RAM, breakpoints, scanline counting You will build: A "landmark" ROM stuffed with recognizable values you'll hunt for in the debugger
Introduction
In Lesson 01 you learned to think in hex and binary. But where do you actually see those bytes? The answer is Stella's debugger — and learning it now, before you write much code, will save you countless hours of frustration later.
Stella is the emulator you'll run every ROM in. Press a single key and it transforms into a full debugger: you can freeze the machine mid-frame, read every byte of RAM, watch the CPU registers change one instruction at a time, and even step the electron beam scanline by scanline. On a machine with no operating system, no console.log, and no error messages, the debugger is your only window into what your code is actually doing.
This lesson is hands-on. You'll build a small ROM whose only job is to plant landmark values — memorable bytes like $DE, $AD, $BE, $EF — into specific RAM addresses. Then you'll open the debugger and go hunting for them. By the end you'll be fluent in the four debugger skills you'll use in every single lesson that follows: reading RAM, watching registers, setting breakpoints, and counting scanlines.
TypeScript Equivalent
If you've used the browser's DevTools or the VS Code debugger, you already understand the concept — Stella's debugger is the same idea applied to a 1977 game console:
// In TypeScript you pause execution and inspect state like this:
function startFrame() {
  let frameCounter = 0;
  debugger;              // ← browser pauses here, like Stella's breakpoint
  frameCounter++;        // step over one line, watch the value change
  console.log(frameCounter); // inspect a variable
}| DevTools / VS Code | Stella Debugger |
|---|---|
debugger; statement / breakpoint dot | break command or breakpoint on an address |
| "Step Over" button | Step |
| Watch / Variables panel | RAM view ($80–$FF) and the registers panel |
| Call stack | The 6502 stack in page $01 (mirrored into RAM) |
| Scrubbing animation frames | Frame advance (one whole TV frame at a time) |
The big difference: in TypeScript a "variable" is named and the runtime tracks it for you. On the 2600 a variable is just an address — and you read it by looking at that address in the RAM view. That's exactly why we practice with landmark values.
Theory
Section 1: Loading a ROM
Running a ROM is simple. From the project root, build it and hand the .bin file to Stella:
make lesson02
stella build/lesson02.binStella boots straight into the emulated game — you'll see the colored bands this lesson's ROM draws. That's the emulation view, the same thing a player would see on a real TV. The interesting part is one keystroke away.
Section 2: Opening the Debugger
Press the backtick key ` (the key above Tab, left of 1) at any time. The emulation freezes and the screen is replaced by the debugger — a dense dashboard of panels.
The panels you'll use constantly:
| Panel | What it shows |
|---|---|
| Prompt | A command line — type commands like break, step, frame, and inspect anything |
| CPU / Registers | The live values of A, X, Y, SP, PC, and the processor flags (NV-BDIZC) |
| RAM | All 128 bytes of RAM, $80–$FF, as a hex grid — this is where your variables live |
| TIA | The graphics chip's current register state (colors, sprite positions, collisions) |
| Disassembly | Your program's instructions, with the next instruction to run highlighted |
Press ` again (or type run) to leave the debugger and resume the game.
PAL Note
The debugger works identically on PAL and NTSC. The only difference you'll notice is the scanline count when you count a frame (Section 6): NTSC frames are ~262 scanlines, PAL frames are ~312. Stella tells you which mode it's emulating in the debugger's status area.
Section 3: Watching the Registers
The CPU has only a handful of registers, and the debugger shows them all at once:
| Register | Name | What it holds |
|---|---|---|
| A | Accumulator | The main working value — almost every LDA/STA touches it |
| X, Y | Index registers | Counters and offsets (our band loops use X) |
| SP | Stack Pointer | Points to the top of the stack in RAM |
| PC | Program Counter | The address of the next instruction to execute |
| P | Processor status | The flag bits: N, V, B, D, I, Z, C |
When you single-step (next section), watch the A register: as the ROM runs LDA #$DE, you'll see A become $DE. Run the STA $80 that follows, and the RAM view's $80 cell changes to $DE. Seeing the value travel from instruction → register → memory is the single most important habit in low-level debugging.
Section 4: Stepping Through Code
The debugger gives you several "how far do I advance?" buttons and commands:
| Action | Command | Advances by |
|---|---|---|
| Step | step (or s) | One instruction |
| Trace | trace (or t) | One instruction, but runs through subroutine calls |
| Scanline | scanline (or scan) | One scanline (handy inside the kernel) |
| Frame | frame (or f) | One whole TV frame |
For this lesson, Step is your friend. You'll step through the six LDA/STA pairs at the start of the program and watch each landmark value land in RAM, one at a time.
Section 5: Setting Breakpoints
A breakpoint tells Stella "run normally, but stop the instant you reach this address." You set one from the Prompt:
break StartFrameYou can also break on a literal address (break $f015) or click an instruction in the disassembly. Once the program hits the breakpoint, it drops into the debugger so you can inspect everything. To clear it, type clearbreaks.
This is exactly how you'd answer questions like "what is the frame counter when the game first reaches the kernel?" — set a breakpoint, let it stop there, and read the value.
Section 6: Counting Scanlines
Every 2600 frame is built from a fixed number of scanlines. You can prove this in the debugger:
- Set a breakpoint on
StartFrame(the top of the main loop). - When it stops, note the scanline counter in the TIA/status area — it resets near the top of each frame.
- Type
frameto advance exactly one frame, and watch the scanline total. For an NTSC frame you should count 262 scanlines (3 VSYNC + 37 VBLANK + 192 visible + 30 overscan).
This is the heartbeat of the whole machine — and in Part 2 you'll spend a lot of time making sure your kernels hit exactly the right scanline counts.
The Code
Building This Lesson
make lesson02
stella build/lesson02.binOr assemble directly with ACME:
acme -f plain -o build/lesson02.bin \
lessons/part0-foundations/02-stella-debugger/02-stella-debugger.asmFull Source
This "landmark" ROM plants recognizable values in RAM, increments a frame counter, hides a secret byte, and draws three colored bands so there's something to look at:
; =============================================================================
; LESSON 02: Meet Stella — Your Debugger and Best Friend
; =============================================================================
; Part 0: Foundations
;
; What this program does:
;   This is a "landmark" ROM — its whole purpose is to give you recognizable
;   values to hunt for inside the Stella debugger. It stores a set of easy-to-
;   spot hex bytes in specific RAM addresses, keeps a running frame counter,
;   and hides one secret value at a higher address for you to find.
;
;   On screen it draws three colored bands so there is visible output and an
;   obvious place to set a breakpoint. The real action, though, happens in the
;   debugger: you will pause the program, read these RAM bytes, watch the
;   registers change, and step through the frame loop one instruction at a time.
;
; RAM landmark map (what you should find in the debugger):
;   $80 = $DE   ; "DEAD" landmark byte 1
;   $81 = $AD   ; "DEAD" landmark byte 2
;   $82 = $BE   ; "BEEF" landmark byte 1
;   $83 = $EF   ; "BEEF" landmark byte 2
;   $84        ; FrameCounter — increments once per frame (watch it climb!)
;   $A5 = $42   ; SecretValue — the "hidden" byte (Exercise 2)
; =============================================================================

    !cpu 6502

; --- Include hardware definitions and macros ---
    !source "include/vcs.asm"
    !source "include/macro.asm"

; =============================================================================
; RAM VARIABLES
; =============================================================================
; We deliberately place memorable values at low, easy-to-find addresses so
; that when you open the debugger's RAM view, the bytes jump out at you.
; "DEAD" and "BEEF" are classic programmer landmark values precisely because
; they are valid hex AND spell something — impossible to miss in a hex dump.

DeadHi          = $80    ; Will hold $DE  — first half of "DEAD"
DeadLo          = $81    ; Will hold $AD  — second half of "DEAD"
BeefHi          = $82    ; Will hold $BE  — first half of "BEEF"
BeefLo          = $83    ; Will hold $EF  — second half of "BEEF"
FrameCounter    = $84    ; Increments once per frame — your "is it running?" proof

; The secret value lives higher up in RAM, away from the landmarks above, so
; that finding it in Exercise 2 takes a little hunting through the RAM view.
SecretValue     = $A5    ; Will hold $42  — the "hidden" byte to discover

; =============================================================================
; ROM START
; =============================================================================

    * = $F000

; =============================================================================
; ENTRY POINT
; =============================================================================
Reset:
    +clean_start         ; Zero all RAM/TIA, set up stack (see include/macro.asm)

    ; --- Plant the landmark values in RAM ---
    ; Set a breakpoint on the first STA below (Exercise 1) and step through
    ; these instructions one at a time. Watch the A register load each value,
    ; then watch the matching RAM address change in the debugger's RAM view.

    LDA #$DE             ; A = $DE  (first "DEAD" byte)
    STA DeadHi           ; $80 = $DE

    LDA #$AD             ; A = $AD  (second "DEAD" byte)
    STA DeadLo           ; $81 = $AD

    LDA #$BE             ; A = $BE  (first "BEEF" byte)
    STA BeefHi           ; $82 = $BE

    LDA #$EF             ; A = $EF  (second "BEEF" byte)
    STA BeefLo           ; $83 = $EF

    ; --- Plant the hidden value ---
    LDA #$42             ; A = $42  (the secret — ASCII 'B')
    STA SecretValue      ; $A5 = $42

; =============================================================================
; MAIN LOOP
; =============================================================================
; Every iteration of this loop draws exactly one NTSC frame. The FrameCounter
; increments once per pass, so in the debugger you can prove the loop is alive
; by watching $84 tick upward — and you can use "frame advance" to step one
; whole frame at a time.

StartFrame:

; --- VSYNC (3 scanlines) ---
    +vsync               ; Tell the TV "new frame" (3 scanlines)

; --- VBLANK (37 scanlines) ---
    LDA #$02
    STA VBLANK           ; Blank the screen during the top margin
    +set_timer 43        ; Start RIOT timer to fill the VBLANK period

    ; === GAME LOGIC ===
    ; Increment our frame counter. This single instruction is the easiest way
    ; to confirm in the debugger that the program is running: pause, note $84,
    ; frame-advance once, and watch it go up by exactly 1.
    INC FrameCounter     ; $84 = $84 + 1
    ; === END GAME LOGIC ===

    +wait_timer          ; Wait out the rest of VBLANK
    LDA #$00
    STA VBLANK           ; Turn the screen back on

; --- KERNEL (192 visible scanlines) ---
; Three equal color bands (64 scanlines each). This gives us visible output
; and three natural "zones" where you can set breakpoints to see exactly where
; the beam is when the debugger pauses.

    ; --- Band 1: red (64 lines) ---
    LDA #$44             ; $44 = red, medium luminance
    STA COLUBK
    LDX #64              ; 64 scanlines in this band
-   STA WSYNC            ; Wait one scanline
    DEX
    BNE -

    ; --- Band 2: green (64 lines) ---
    LDA #$C4             ; $C4 = green, medium luminance
    STA COLUBK
    LDX #64
-   STA WSYNC
    DEX
    BNE -

    ; --- Band 3: blue (64 lines) ---
    LDA #$94             ; $94 = blue, medium luminance
    STA COLUBK
    LDX #64
-   STA WSYNC
    DEX
    BNE -

; --- OVERSCAN (30 scanlines) ---
    LDA #$02
    STA VBLANK           ; Blank the screen during the bottom margin
    +set_timer 35        ; Start RIOT timer to fill the overscan period

    +wait_timer          ; Wait out the rest of overscan

    JMP StartFrame       ; Round and round — one pass = one frame

; =============================================================================
; VECTORS
; =============================================================================

    * = $FFFA
    !word Reset     ; NMI
    !word Reset     ; RESET
!word Reset ; IRQCode Walkthrough
Planting the Landmarks
Right after +clean_start, the program stores five memorable bytes:
| Instruction | Effect | Find it in the RAM view |
|---|---|---|
LDA #$DE / STA $80 | $80 = $DE | "DE" |
LDA #$AD / STA $81 | $81 = $AD | "AD" |
LDA #$BE / STA $82 | $82 = $BE | "BE" |
LDA #$EF / STA $83 | $83 = $EF | "EF" |
LDA #$42 / STA $A5 | $A5 = $42 | the secret |
Read across $80–$83 in the debugger and you'll literally see DE AD BE EF — the classic landmark words "DEAD BEEF." They're chosen precisely because they're valid hex and spell something, so they're impossible to overlook in a wall of hex.
The Frame Counter
Inside the main loop, a single instruction does all the work we need to prove the program is alive:
INC FrameCounter ; $84 = $84 + 1Pause the program, note the value at $84, type frame to advance one frame, and watch $84 go up by exactly 1. That's your "yes, it's running" signal.
The Kernel — Three Bands
The kernel draws three 64-scanline bands (red, green, blue) using the same LDX #64 / STA WSYNC / DEX / BNE loop you saw in Lesson 01. Three equal bands × 64 lines = 192 visible scanlines. These bands also give you three obvious places to set a scanline breakpoint and see where the beam is when the debugger stops.
What You Should See
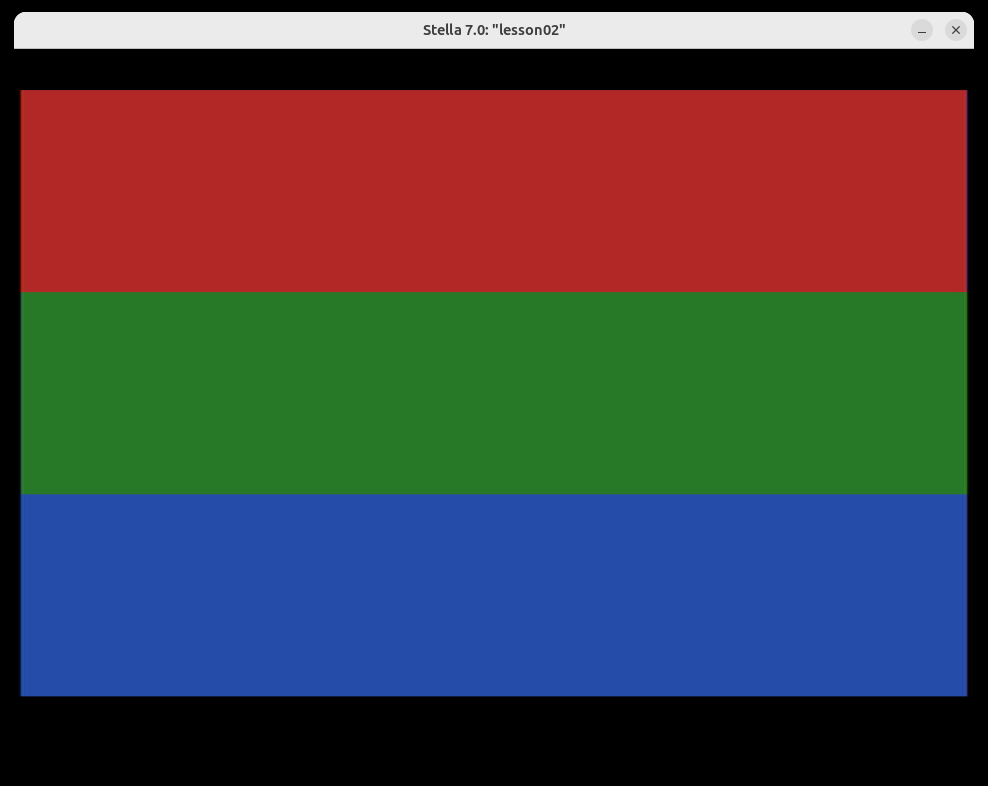
When you run this ROM in Stella, the emulation view shows three equal horizontal bands — red on top, green in the middle, blue on the bottom:
Now press ` to open the debugger and confirm the landmarks:
- Find the RAM view and read addresses
$80through$83. You should seeDE AD BE EF. - Look at
$84(the frame counter). Typeframea few times and watch it climb. - Hunt for the secret value: somewhere in RAM is a byte holding
$42. (It's at$A5— but try to find it before you peek.) - Set
break StartFrame, resume, and when it stops, count the scanlines in oneframe.
Exercises
Exercise 1: Step Through the Landmarks
Challenge: Open the debugger, set a breakpoint on Reset, and single-step through the six LDA/STA instructions. After each STA, confirm the matching RAM address changed.
Hints:
- Type
break Resetin the Prompt, thenrun(or reset the ROM) so it stops at the entry point. - Use
steprepeatedly. After eachLDA, watch the A register; after eachSTA, watch the RAM cell. - The clean-start macro zeros RAM first, so every landmark address starts at
$00before itsSTA.
Expected Result: You watch A take the values $DE, $AD, $BE, $EF, $42 in turn, and immediately afterward see those same values appear at $80, $81, $82, $83, and $A5. Reading $80–$83 together spells DE AD BE EF.
Exercise 2: Find the Hidden Value
Challenge: Without reading the source's RAM map comment, find the address in RAM that holds the value $42.
Hints:
- The landmark bytes live at the very bottom of RAM (
$80–$84). The secret is somewhere above them. - Scan down the RAM view column by column looking for a lone
42among the zeros. - Most of RAM is
$00(thanks to clean-start), so a non-zero byte stands out.
Expected Result: You locate $42 at address $A5. Everything between the landmarks and $A5 is $00, which is what makes the secret easy to spot once you know to look for a non-zero byte.
Exercise 3: Count a Frame's Scanlines (Stretch Goal)
Challenge: Use the debugger to verify that this ROM produces a full 262-scanline NTSC frame.
Hints:
- Set
break StartFrameso the program stops at the top of each frame. - Note the scanline counter when it stops, then type
frameto advance exactly one frame. - Add up the regions yourself: 3 (VSYNC) + 37 (VBLANK) + 192 (kernel: 3×64) + 30 (overscan).
Expected Result: One full frame measures 262 scanlines. The kernel contributes 192 of them (three 64-line bands), bracketed by the 3 + 37 lines above and 30 lines below. If you ever see a number far from 262, that's the debugger telling you the frame timing is wrong — a skill you'll lean on heavily in Part 2.
Key Takeaways
- ✅ Press
`(backtick) to toggle Stella's debugger;runresumes the game - ✅ The RAM view ($80–$FF) is where your variables live — read addresses to inspect state
- ✅ Step advances one instruction; Frame advances one whole TV frame; watch A/X/Y/SP/PC change as you go
- ✅ A breakpoint (
break <address>) freezes the machine the instant it reaches that address - ✅ Landmark values like
$DEAD/$BEEFmake state easy to spot in a hex dump — a trick you'll reuse forever - ✅ One NTSC frame = 262 scanlines (3 + 37 + 192 + 30), and the debugger lets you count them
What's Next
In Lesson 03: Anatomy of the Atari 2600, you'll learn what's actually inside the machine — the three chips (6507 CPU, TIA, RIOT), the memory map, and how a cartridge plugs into it all. With the debugger now in your toolkit, you'll be able to see each chip's registers as we explore them.